Avicenna Journal of Pharmaceutical Research. :17-22.
doi: 10.34172/ajpr.2022.1056
Original Article
Comparison of the Hepatotoxicity of Carbamazepine, Sodium Valproate, Phenytoin, Lamotrigine, and Vigabatrin in a Rat Model
Vahid Ramezani 1  , Fatemeh Tavakoli 2, * , Azadeh Emami 1 , Seyyed Ali Javadi 2
Author information:
1Department of Pharmaceutics, Faculty of Pharmacy and Pharmaceutical Sciences Research Center, Shahid Sadoughi University of Medical Sciences, Yazd, Iran
2Department of Toxicology and Pharmacology, Faculty of Pharmacy and Pharmaceutical Sciences Research Center, Shahid Sadoughi University of Medical Sciences, Yazd, Iran
Abstract
Background: Hepatotoxicity is one of the most important side effects of anticonvulsant drugs. This study compared the hepatotoxicity of sodium valproate, carbamazepine, phenytoin, lamotrigine, and vigabatrin in male rats.
Methods: Based on the results, 56 rats were randomly divided into seven groups of eight and treated intraperitoneally for four weeks. Groups 1 and 2 received 500 mg/kg of carbamazepine and sodium valproate, and groups 3, 4, and 5 were injected with 200 mg/kg of phenytoin, 200 mg/kg lamotrigine, and 500 mg/kg vigabatrin, respectively. As control groups, the sixth and seventh received distilled water and sesame oil. Biochemical parameters such as alanine aminotransferase (ALT), aspartate transaminase (AST), and γ-glutamyl transferase (GGT) in the serum samples, as well as malondialdehyde (MDA) and glutathione (GSH) contents in liver homogenates, were measured at the end of the experiment.
Results: MDA levels in carbamazepine and phenytoin groups were significantly higher than that in sodium valproate, lamotrigine, vigabatrin, and control groups (P<0.05). GSH levels in carbamazepine and phenytoin groups were meaningfully higher compared to the groups that received sodium valproate (P<0.05), vigabatrin, and control groups (P<0.001). Based on the results, the GGT level in the carbamazepine group was remarkably higher in comparison with the other groups (P<0.01). ALT and AST represented considerably higher levels in the phenytoin group compared to the vigabatrin, sodium valproate, and control groups (P<0.01).
Conclusion: Overall, carbamazepine-induced hepatotoxicity caused the most significant changes in GSH, GGT, and AST. The induction of hepatotoxicity with sodium valproate had the least effect on enzymes and was significantly different compared to carbamazepine and phenytoin groups. Because of no hepatic metabolism, the level of biomarkers did not demonstrate a considerable difference between vigabatrin and the control groups.
Keywords: Carbamazepine, Sodium valproate, Phenytoin, Lamotrigine, Hepatotoxicity
Copyright and License Information
© 2022 The Author(s); Published by Hamadan University of Medical Sciences.
This is an open-access article distributed under the terms of the Creative Commons Attribution License (
http://creativecommons.org/licenses/by/4.0), which permits unrestricted use, distribution, and reproduction in any medium, provided the original work is properly cited.
Please cite this article as follows: Ramezani V, Tavakoli F, Emami A, Javadi SA. Comparison of the hepatotoxicity of carbamazepine, sodium valproate, phenytoin, lamotrigine, and vigabatrin in a rat model. Avicenna J Pharm Res. 2022; 3(1):17-22. doi:10.34172/ajpr.2022.1056
Introduction
One of the most common neurological diseases is epilepsy with a prevalence of 8.2-12.9/1000 (1,2). Nearly 65 million people suffer from this disease worldwide (3). Patients with chronic epilepsy experience cognitive impairment, anxiety, psychosis, depression, endocrine, and somatic disorders (4-10).Around 70% of people who receive an antiepileptic drug no longer have seizures, and about 30% of them develop a chronic form of epilepsy that is often resistant to pharmacological therapy;these might experience intolerable side effects and recurrent seizures. Approximately one-third of patients with epilepsy require life-long treatment. Various medications are widely prescribed for treating epilepsy, bipolar disorders, and mania (11-13).
Although traditional antiepileptic drugs, including phenytoin, carbamazepine, valproic acid (VPA), ethosuximide, and phenobarbital, are efficient against seizures, their administration may be associated with clinically significant cognitive and behavioral complications, affecting many patients’ quality of life (11). The administration of medications, including sodium valproate, can increase the activities of liver enzymes and the level of malondialdehyde (MDA), while it can decrease the level of glutathione (GSH). Another study also reported that hepatotoxicity induced by antiepileptic medication may cause acute liver failure, leading to liver transplantation (14).
According to these findings, anticonvulsant drugs cause many side effects in addition to their usefulness. In some cases, these problems may lead to the discontinuation of the drug or its replacement with other medications due to the patient’s dynamic and kinetic responses.
The incidence of different types of seizures is high, and there is no comprehensive study regarding the liver toxicity of these medications, including phenytoin, carbamazepine, vigabatrin, sodium valproate, and lamotrigine in the treatment of epilepsy and seizure; accordingly, this study was conducted aiming at evaluating and comparing the hepatotoxicity of phenytoin, carbamazepine, vigabatrin, sodium valproate, and lamotrigine in the rat model (15).
Materials and Methods
Materials
Trichloroacetic acid (TCA), n-butanol, and 2-thiobarbituric acid (TBA) were purchased from Merck Chemical Company (Darmstadt, Germany). In addition, carbamazepine, sodium valproate, phenytoin, lamotrigine, and vigabatrin were provided from Sigma-Aldrich Chemical Company (St. Louis, MO, USA).
Animals
In this experimental study, 56 male Wistar rats in the weight range of 180-220 g were purchased from the animal house of Yazd Reproductive Sciences Institute. These rats were maintained under cyclic light (12 hours lighting/12 hours darkness) at 23 ± 2°C temperature and had access to adequate water and food. Then, they were randomly divided into 7 groups of eight.
Experimental Protocol and Groups
Groups 1 and 2 received 500 mg/kg of carbamazepine and 500 mg/kg of sodium valproate, respectively. The third, fourth, and fifth groups were injected with 200 mg/kg phenytoin, 200 mg/kg lamotrigine, and 500 mg/kg vigabatrin, respectively. The sixth and seventh groups received distilled water and sesame oil, respectively, as control groups. Rats received therapy for one month by intraperitoneal injection.
Twenty-four hours after receiving the last dose of the drug, the animals were anesthetized with the intraperitoneal injection of a mixture of xylazine (5 mg/kg) and ketamine (75 mg/kg). After anesthesia and animal fixation, the rats underwent surgery, and blood samples were taken from the left ventricle of the rats using a 5 cc syringe. Then, the serum was separated using an Eppendorf centrifuge and stored at -80 centigrade.
Preparation of Homogeneous Liver Samples
After surgery, the liver was gently removed based on the ZellBio Company’s kit instruction. Then, the separated supernatant was stored at -80°C, and MDA and GSH were measured in these samples.
Biochemical Assays
Determination of Alanine Aminotransferase and Aspartate Transaminase Activities
Alanine aminotransferase (ALT) and aspartate transaminase (AST) activities were determined by the enzymatic method using Pars Azmoun (Iran) kits at a wavelength of 340 nm based on the manufacturer’s protocols.
Measurement of Glutathione
The concentration of reduced GSH was determined using an ELISA kit (ZellBio GmbH) at a wavelength of 450 nm according to the instruction of the manufacturer. The results are expressed as μmol GSH/g tissue.
Lipid Peroxidation Measurement
Lipid peroxidation on the liver samples was specific to the reaction of TBA with MDA. Based on our previous study, first, liver homogenates were mixed with TCA (20%), and the obtained precipitate was dispersed in H2SO4 with a concentration of 0.05 M. Then, TBA (0.2% in 2 M sodium sulfate) was added as well. Test tubes were heated in a boiling water bath for 30 minutes, then the lipid peroxidation adducts were extracted using n-butanol, and their absorbance was measured at 532 nm wavelength. The obtained result was reported as nmol MDA/g tissue (16).
Determination of Gamma-glutamyl Transferase Activity
The activity of gamma-glutamyl transferase (GGT) was assessed using the Pars Azmoon kit (based on the enzymatic method) at 412 nm.
Statistical Analyses
Data were compared using a one-way analysis of variance and as mean ± standard deviation. Further, the Tukey-Kramer multiple comparison test was performed to compare between groups, representing significant differences. P < 0.05 was assumed to be significant. Finally, GraphPad InStat software (version 3.10) was used for all statistical analyses.
Results
Determination of Aspartate Transaminase Activities
The mean AST level in the carbamazepine group was remarkably higher than that in the other groups. The highest and lowest levels of AST were observed in the carbamazepine (10.4 ± 2.5) and oil carrier (2.1 ± 0.9) groups, respectively. The mean AST level in the carbamazepine group was considerably higher than that in the sodium valproate group (P < 0.05). In addition, the mean AST level in the carbamazepine and lamotrigine groups was significantly higher compared to vigabatrin, aqueous and lipid carrier groups (P < 0.05), but there was no remarkable difference between the carbamazepine and phenytoin groups regarding AST levels (P > 0.05, Figure 1).
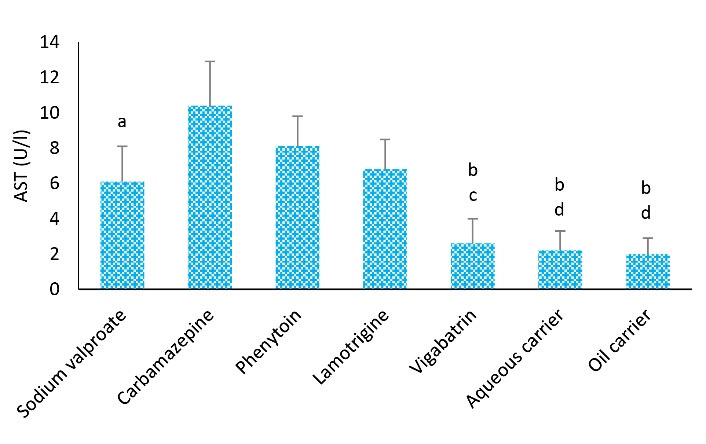
Figure 1.
Effects of Different Treatments on Serum AST Levels in Rats. Note. ANOVA: Analysis of variance; SD: Standard deviation; AST: Aspartate transaminase. One-way ANOVA with the Tukey’s test was used for statistical analysis. Values are shown as means ± SD, n = 8 for each group. a: The AST level was remarkably different from the carbamazepine group (P < 0.05), b: AST level was remarkably differentfrom the carbamazepine group (P < 0.01), c: AST level showed a significant difference in the group that received phenytoin (P < 0.05), d: AST level showed a significant difference of phenytoin group (P < 0.01)
.
Effects of Different Treatments on Serum AST Levels in Rats. Note. ANOVA: Analysis of variance; SD: Standard deviation; AST: Aspartate transaminase. One-way ANOVA with the Tukey’s test was used for statistical analysis. Values are shown as means ± SD, n = 8 for each group. a: The AST level was remarkably different from the carbamazepine group (P < 0.05), b: AST level was remarkably differentfrom the carbamazepine group (P < 0.01), c: AST level showed a significant difference in the group that received phenytoin (P < 0.05), d: AST level showed a significant difference of phenytoin group (P < 0.01)
Determination of Alanine Aminotransferase Activities
Figure 2 shows the comparison of different groups considering the ALT level. Based on the results, the mean level of ALT in the vigabatrin group was lower than in the other groups. The highest level of ALT was found in the phenytoin group (12.3 ± 1.3), while the lowest level of ALT was observed in the lipid carrier group (4 ± 1.1).
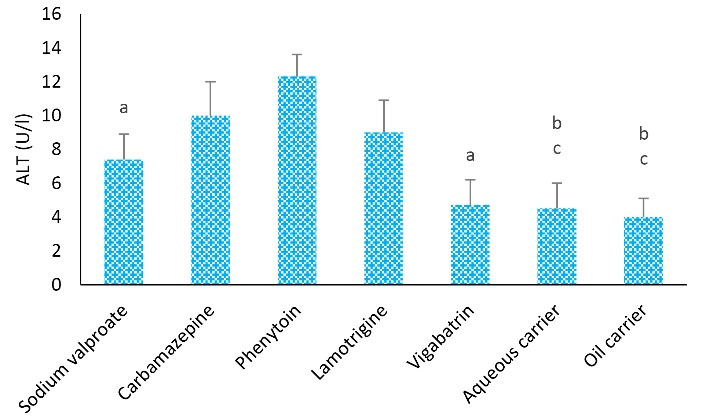
Figure 2.
Effects of Different Treatments on Serum ALT Levels in Rats. Note. ANOVA: Analysis of variance; SD: Standard deviation. One-way ANOVA with Tukey’s test was used for statistical analysis. Values are shown as means ± SD, n = 8 for each group. a: ALT level represented a remarkable difference from that group treated with phenytoin (P < 0.05), b: ALT level showed a remarkable difference from the phenytoin group (P < 0.01), c: ALT level demonstrated a remarkable difference from the carbamazepine group (P < 0.01)
.
Effects of Different Treatments on Serum ALT Levels in Rats. Note. ANOVA: Analysis of variance; SD: Standard deviation. One-way ANOVA with Tukey’s test was used for statistical analysis. Values are shown as means ± SD, n = 8 for each group. a: ALT level represented a remarkable difference from that group treated with phenytoin (P < 0.05), b: ALT level showed a remarkable difference from the phenytoin group (P < 0.01), c: ALT level demonstrated a remarkable difference from the carbamazepine group (P < 0.01)
Further, the mean level of ALT in the phenytoin group was remarkably higher than that of the sodium valproate, vigabatrin (P < 0.05), aqueous carrier, and lipid carrier groups (P < 0.01). The mean ALT level in the carbamazepine group demonstrated a higher level in comparison with the aqueous and lipid carrier groups (P < 0.01).
Measurement of Glutathione
The highest level of GSH was found in the carbamazepine (0.28 ± 0.02) and phenytoin (0.27 ± 0.005) groups. After 4 weeks of treatment, the mean GSH level in the vigabatrin-treated group was significantly lower than the mean level in the other groups. Additionally, the mean level of GSH in the groups receiving carbamazepine was significantly higher than that of sodium valproate (P < 0.05), vigabatrin (P < 0.05), aqueous carrier, and lipid carrier groups (P < 0.001). Furthermore, the mean level of GSH in the group treated with phenytoin was remarkably higher compared to the aqueous and lipid carrier groups (P < 0.01, Figure 3).
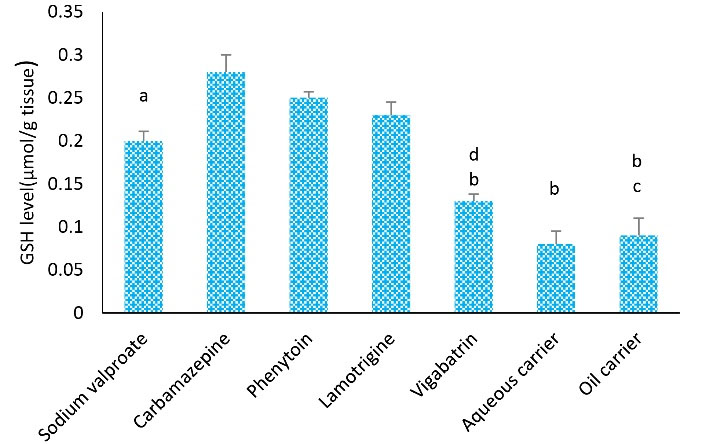
Figure 3.
Effects of Different Kinds of Treatments on Tissue GSH Levels in Rats. Note. ANOVA: Analysis of variance; SD: Standard deviation; GSH: Glutathione; One-way ANOVA with Tukey’s test was used for statistical analysis. Values are shown as means ± SD for each group (n = 8). a: GSH level was remarkably different from the carbamazepine group (P < 0.05), b: GSH level represented a remarkable difference from the phenytoin group (P < 0.01), c: The level of GSH was significantly different compared to the carbamazepine group (P < 0.001), and d: The level of GSH was considerably different in comparison to the carbamazepine group (P < 0.01)
.
Effects of Different Kinds of Treatments on Tissue GSH Levels in Rats. Note. ANOVA: Analysis of variance; SD: Standard deviation; GSH: Glutathione; One-way ANOVA with Tukey’s test was used for statistical analysis. Values are shown as means ± SD for each group (n = 8). a: GSH level was remarkably different from the carbamazepine group (P < 0.05), b: GSH level represented a remarkable difference from the phenytoin group (P < 0.01), c: The level of GSH was significantly different compared to the carbamazepine group (P < 0.001), and d: The level of GSH was considerably different in comparison to the carbamazepine group (P < 0.01)
Measurement of Lipid Peroxidation
As depicted in Figure 4, the level of MDA in the carbamazepine group was significantly higher than sodium valproate and lamotrigine (P < 0.05), vigabatrin, aqueous carrier, and lipid carrier groups (P < 0.001). Further, the level of MDA in the phenytoin group was remarkably higher than in lamotrigine, sodium valproate (P < 0.001), vigabatrin, aqueous carrier, and lipid carrier groups (P < 0.001).
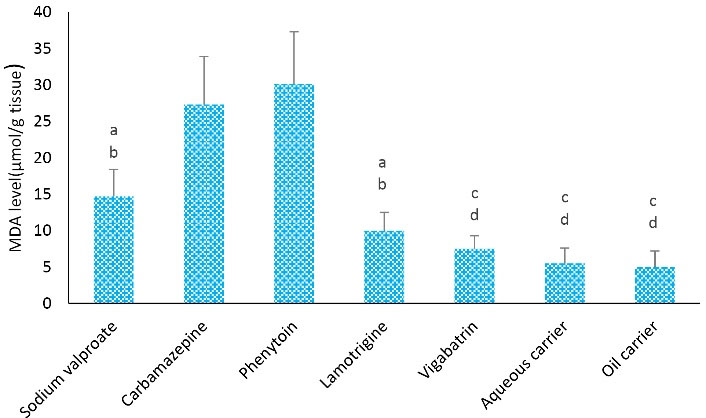
Figure 4.
Effects of Different Treatments on Tissue MDA Levels in Rats. Note. MDA: Malondialdehyde; ANOVA: Analysis of variance; SD: Standard derivation; One-way ANOVA with Tukey’s test was employed for statistical analysis. Values are demonstrated0 as means ± SD for each group (n = 8). a: MDA level was remarkably different from the carbamazepine group (P < 0.05), b: MDA level showed a remarkable difference from the phenytoin group (P < 0.001), c: MDA level was remarkably different compared to the carbamazepine group (P < 0.001), and d: MDA level was remarkably different compared to the phenytoin group (P < 0.0001)
.
Effects of Different Treatments on Tissue MDA Levels in Rats. Note. MDA: Malondialdehyde; ANOVA: Analysis of variance; SD: Standard derivation; One-way ANOVA with Tukey’s test was employed for statistical analysis. Values are demonstrated0 as means ± SD for each group (n = 8). a: MDA level was remarkably different from the carbamazepine group (P < 0.05), b: MDA level showed a remarkable difference from the phenytoin group (P < 0.001), c: MDA level was remarkably different compared to the carbamazepine group (P < 0.001), and d: MDA level was remarkably different compared to the phenytoin group (P < 0.0001)
Determination of GGT Activity
A comparison of different groups considering the GGT level is displayed in Figure 5. After 4 weeks of treatment, the mean level of GGT in the vigabatrin-treated group was considerably lower than the other groups. The highest and lowest levels of GGT were observed in the carbamazepine-treated (10 ± 2.1) and lipid carrier (2.5 ± 1.1) group.
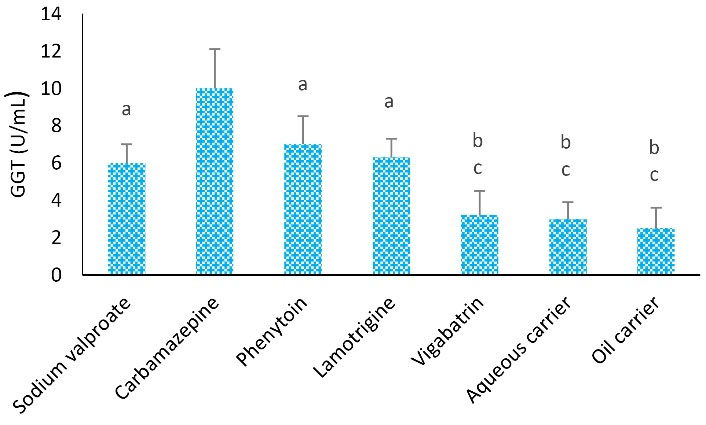
Figure 5.
Effects of Different Treatments in Serum GGT Levels in Rats. Note. ANOVA: Analysis of variance; SD: Standard deviation; GGT: γ-glutamyl transferase. One-way ANOVA with Tukey’s test was used for statistical analysis. Values are shown as means ± SD for each group (n = 8). a: GGT level was remarkably different compared to the carbamazepine group (P < 0.05), b: GGT level was considerably different compared to the phenytoin group (P < 0.01), and c: GGT level was significantly different from the carbamazepine group (P < 0.01)
.
Effects of Different Treatments in Serum GGT Levels in Rats. Note. ANOVA: Analysis of variance; SD: Standard deviation; GGT: γ-glutamyl transferase. One-way ANOVA with Tukey’s test was used for statistical analysis. Values are shown as means ± SD for each group (n = 8). a: GGT level was remarkably different compared to the carbamazepine group (P < 0.05), b: GGT level was considerably different compared to the phenytoin group (P < 0.01), and c: GGT level was significantly different from the carbamazepine group (P < 0.01)
The average level of GGT in the carbamazepine group was significantly higher than that of phenytoin, lamotrigine, and sodium valproate (P < 0.05), vigabatrin, aqueous carrier, and lipid carrier groups (P < 0.01). Furthermore, the average level of GGT was remarkably higher in the phenytoin group than in the vigabatrin and aqueous and lipid carrier (P < 0.05) groups. However, the levels of GGT in sodium valproate and lamotrigine groups were considerably higher than in aqueous and lipid carrier groups; however, no significant difference was found regarding the level of GGT among them (P > 0.05).
Discussion
This study aimed to compare the hepatotoxicity of sodium valproate, carbamazepine, phenytoin, lamotrigine, and vigabatrin as commonly used drugs in the treatment of epilepsy and seizure.
According to the findings of the present study, the use of carbamazepine and phenytoin led to more oxidative stress (OS) and inhibited the activity of antioxidant enzymes. Santhrani et al reported that the long-term use of carbamazepine caused an imbalance between the antioxidant and oxidative systems, which significantly increased OS. Moreover, carbamazepine caused OS through the production of reactive oxygen species (17). De Oliva showed using carbamazepine caused OS by the production of reactive oxygen species and free radicals (18). Therefore, according to the finding of our study and other studies, the use of carbamazepine led to a high level of MDA, which is an indicator of OS.
Moreover, after 4 weeks of treatment, the mean level of GSH in the group treated with sodium valproate was lower than that in the other groups. The effect of VPA depends on a range of actions such as the facilitation of GABAergic neurotransmission and the regulation of ionic currents (19). In addition, VPA indirectly adjusts the release of neurotransmitters and enhances the threshold value of seizure activity (19).Other studies revealed that sodium valproate increased lipid peroxidation in children with epilepsy and decreased glutathione peroxidase (20-23). The finding of the current study is consistent with those of the above-mentioned studies.
The comparison of groups regarding the GGT level demonstrated that the mean level of GGT in the carbamazepine group was significantly higher than in phenytoin, lamotrigine, sodium valproate, vigabatrin, aqueous carrier, and lipid carrier groups. In this research, the mean level of GGT in sodium valproate, phenytoin, and lamotrigine groups was higher than the aqueous and lipid carrier groups, but no statistically significant difference was observed among these groups considering GGT. Further, GGT levels were lower in the sodium valproate group in comparison to the other antiepileptic drugs.
Willmore et al studied the effect of valproic acid on hepatic function, they concluded that just dose reduction may be effective in preventing unwanted valproate hepatic side effects (24). Hadzagic-Catibusic et al evaluated the effect of carbamazepine and valproate on the GGT level in children and reported that GGT levels were significantly higher in the carbamazepine group than in sodium valproate (25). Likewise, Sano et al found that the serum GGT activity of the phenytoin groups was higher than that of the phenobarbital group (26). Kürekçi et al also represented an increase in the GGT level as a pharmacological side effect of carbamazepine (27). Furthermore, serum GGT levels appear to be affected by various factors, including alcohol intake, body fat, lipoprotein levels, glucose levels, and various medications.
Moreover, the mean level of ALT in the sodium valproate group was lower compared to the other groups. The highest level of ALT was observed in the phenytoin group (12.3 ± 1.3). Similarly, Hossein et al investigated the effect of antiepileptic medicine on liver enzymes; they did not observe a statistically significant difference in ALT and AST levels between sodium valproate, phenytoin, and carbamazepine groups (28). Hadzagic-Catibusic et al also assessed the effect of VPA on the AST and ALT levels and found that the levels of these enzymes had been elevated after treatment (25).
Vidaurre et al reported that selecting the most appropriate antiepileptic is challenging because of the metabolization of most medications in the liver, and newer antiepileptic drugs, including levetiracetam, topiramate, lacosamide, pregabalin, and gabapentin should be prescribed as the first-line treatment in these patients. Further, medications such as felbamate, VPA, and phenytoin should be used as the last-line treatment due to extensive liver toxicity (29).
Demircioğlu et al evaluated the effect of carbamazepine and VPA on the liver function of children and observed that the levels of ALT and AST did not increase 6 months after sodium valproate and carbamazepine administration, which is inconsistent with the findings of the present study. It should also be noted that an increase in liver enzymes may be affected by the dose of sodium valproate. Additionally, an increase in liver enzymes in the sodium valproate group was lower than in other anticonvulsant drugs in the current study (30).
In the present study, the mean AST level in the carbamazepine group represented a higher level than the average level of the other groups. The highest and lowest levels of AST were observed in the carbamazepine (11.4 ± 2.5) and lipid carrier (2.6 ± 2.08) groups, respectively. The AST level in the carbamazepine group was considerably higher than sodium valproate, lamotrigine, lipid carrier, and aqueous carrier groups, but no considerable difference was observed between the two groups (carbamazepine and phenytoin groups) regarding the AST level. Shams et al found that hepatotoxicity induced by anticonvulsant drugs such as phenytoin increases liver transferase enzymes, which is in conformity with the findings of the current research (23). Sillanpaa et al revealed that approximately 15% of patients who were treated with carbamazepine experienced an increase in AST levels, which is in line with the results of our study (31).
Finally, our findings showed that the lowest rate of hepatotoxicity among all studied drugs was related to vigabatrin. It can selectively and irreversibly act through inhibiting GABA transaminase (the enzyme responsible for GABA metabolism). The measurement of cerebrospinal fluid before and after treatment with Vigabatrin in patients with seizures indicated a dose-dependent increase in total GABA, and free GABA (32). Vigabatrin does not bind to proteins and is not metabolized by the microsomal oxidase enzyme system. Therefore, vigabatrin may be given once or twice a day due to its long-lasting medicinal effect (33).
Conclusion
Based on the findings of the current study, the administration of carbamazepine led to the highest change in GSH, GGT, and AST levels compared to other drugs. Sodium valproate had low effects on the level of enzymes. Vigabatrin caused minor changes in the biomarker levels due to the lack of liver metabolism; therefore, no remarkable difference was observed between vigabatrin and control groups regarding biomarker levels.
Authors’ Contributions
Conceptualization: Fatmeh Tavakoli.
Data curation: Fatmeh Tavakoli.
Formal Analysis: Azadeh Emami.
Investigation: Vahid Ramezani.
Methodology: Fatmeh Tavakoli.
Project administration: Fatmeh Tavakoli.
Resources: Fatmeh Tavakoli, Azadeh Emami.
Software: Not Applicable.
Supervision: Fatmeh Tavakoli, Vahid Ramezani.
Validation: Fatmeh Tavakoli.
Visualization: Fatmeh Tavakoli, Seyyed Ali Javadi.
Writing – original draft: Azadeh Emami.
Writing – review & editing: Fatmeh Tavakoli.
Competing Interests
The authors declare that they have no conflict of interests.
Ethical Approval
All animal procedures were approved by the Ethics Committee of Shahid Sadoughi University of Medical Sciences (IR.SSU.MEDICINE.REC.1397.100).
Funding
This work was supported by a grant (No. 8899) from Shahid Sadoughi University of Medical Sciences.
References
- Hamed SA. The auditory and vestibular toxicities induced by antiepileptic drugs. Expert Opin Drug Saf 2017; 16(11):1281-94. doi: 10.1080/14740338.2017.1372420 [Crossref] [ Google Scholar]
- Kandil MR, Ahmed WM, Sayed A, Hamed SA. Pattern of epilepsy in childhood and adolescence: a hospital-based study. Afr J Neurol Sci 2007; 26(1):33-44. doi: 10.4314/ajns.v26i1.7592 [Crossref] [ Google Scholar]
- Verrotti A, Tambucci R, Di Francesco L, Pavone P, Iapadre G, Altobelli E. The role of polytherapy in the management of epilepsy: suggestions for rational antiepileptic drug selection. Expert Rev Neurother 2020; 20(2):167-73. doi: 10.1080/14737175.2020.1707668 [Crossref] [ Google Scholar]
- Hamed SA. The aspects and mechanisms of cognitive alterations in epilepsy: the role of antiepileptic medications. CNS Neurosci Ther 2009; 15(2):134-56. doi: 10.1111/j.1755-5949.2008.00062.x [Crossref] [ Google Scholar]
- Hamed SA. Psychiatric symptomatologies and disorders related to epilepsy and antiepileptic medications. Expert Opin Drug Saf 2011; 10(6):913-34. doi: 10.1517/14740338.2011.588597 [Crossref] [ Google Scholar]
- Hamed SA, Metwaly NA, Hassan MM, Mohamed KA, Ahmad MA, Soliman AA. Depression in adults with epilepsy: relationship to psychobiological variables. World J Neurol 2012; 2(1):1-10. doi: 10.5316/wjn.v2.i1.1 [Crossref] [ Google Scholar]
- Hamed SA, Elserogy YM, Abd-Elhafeez HA. Psychopathological and peripheral levels of neurobiological correlates of obsessive-compulsive symptoms in patients with epilepsy: a hospital-based study. Epilepsy Behav 2013; 27(2):409-15. doi: 10.1016/j.yebeh.2013.01.022 [Crossref] [ Google Scholar]
- Hamed SA. Leptin and insulin homeostasis in epilepsy: relation to weight adverse conditions. Epilepsy Res 2007; 75(1):1-9. doi: 10.1016/j.eplepsyres.2007.04.001 [Crossref] [ Google Scholar]
- Hamed SA. Antiepileptic drugs influences on body weight in people with epilepsy. Expert Rev Clin Pharmacol 2015; 8(1):103-14. doi: 10.1586/17512433.2015.991716 [Crossref] [ Google Scholar]
- Hamed SA, Hamed EA, Kandil MR, El-Shereef HK, Abdellah MM, Omar H. Serum thyroid hormone balance and lipid profile in patients with epilepsy. Epilepsy Res 2005; 66(1-3):173-83. doi: 10.1016/j.eplepsyres.2005.08.004 [Crossref] [ Google Scholar]
- Stöhr T, Kupferberg HJ, Stables JP, Choi D, Harris RH, Kohn H. Lacosamide, a novel anti-convulsant drug, shows efficacy with a wide safety margin in rodent models for epilepsy. Epilepsy Res 2007; 74(2-3):147-54. doi: 10.1016/j.eplepsyres.2007.03.004 [Crossref] [ Google Scholar]
- Abdel-Daeem SM, Shehata AM, Foda FM, El-Hodairy F, Ibrahim HM. The hepatoprotective impact of Moringa oleifera leaves extract against sodium valproate-induced liver toxicity in adult rats. World J Pharm Res 2018; 7(2):34-51. doi: 10.20959/wjpr20182-10567 [Crossref] [ Google Scholar]
- Sepahi S, Riahi-Zanjani B, Ghorani-Azam A. Effect of valproic acid on metabolic status and endocrine system in pediatric patients with epilepsy: systematic literature review. Rev Clin Med 2017; 4(1):7-13. doi: 10.22038/rcm.2016.6490 [Crossref] [ Google Scholar]
- Shaalan S, El-Wakkad AS, Saleh H, Deab A. Protective effect of L-carnitine and baker yeast saccharomyces cerevisiae against hepatic toxicity induced by valproate as antiepileptic drug in rats. Int J Pharm Pharm Sci 2015; 7(5):89-95. [ Google Scholar]
- Ahsan B, Khomand P, Taatiie M, Molanaiie A. Assessment of the prevalence rate of status epilepticus and its underlying factors among adults and children. Sci J Kurd Univ Med Sci 2013;18(1):1-7. [Persian].
- Nili-Ahmadabadi A, Tavakoli F, Hasanzadeh G, Rahimi H, Sabzevari O. Protective effect of pretreatment with thymoquinone against Aflatoxin B1 induced liver toxicity in mice. Daru 2011; 19(4):282-7. [ Google Scholar]
- Santhrani T, Maheswari E, Saraswathy GR. Carbamazepine provoked hepatotoxicity: attenuation by vitamin C. Oxid Antioxid Med Sci 2013; 2(1):37-43. doi: 10.5455/oams.270113.or.026 [Crossref] [ Google Scholar]
- de Oliva SU, Miraglia SM. Carbamazepine damage to rat spermatogenesis in different sexual developmental phases. Int J Androl 2009; 32(5):563-74. doi: 10.1111/j.1365-2605.2008.00898.x [Crossref] [ Google Scholar]
- Romoli M, Mazzocchetti P, D’Alonzo R, Siliquini S, Rinaldi VE, Verrotti A. Valproic Acid and Epilepsy: From Molecular Mechanisms to Clinical Evidences. Curr Neuropharmacol 2019; 17(10):926-46. doi: 10.2174/1570159x17666181227165722 [Crossref] [ Google Scholar]
- Gutiérrez-Alvarez AM, Moreno CB, González-Reyes RE. [Changes in selenium levels in epilepsy]. Rev Neurol 2005; 40(2):111-6. [ Google Scholar]
- Ashrafi MR, Shabanian R, Abbaskhanian A, Nasirian A, Ghofrani M, Mohammadi M. Selenium and intractable epilepsy: is there any correlation?. Pediatr Neurol 2007; 36(1):25-9. doi: 10.1016/j.pediatrneurol.2006.09.001 [Crossref] [ Google Scholar]
- Safaralizadeh R, Kardar GA, Pourpak Z, Moin M, Zare A, Teimourian S. Serum concentration of selenium in healthy individuals living in Tehran. Nutr J 2005; 4:32. doi: 10.1186/1475-2891-4-32 [Crossref] [ Google Scholar]
- Shams S, Ashrafi MR, Nori M, Irani H, Haghi Ashtiani MT, Mohseni A. Selenium and glutathione peroxidase deficiency in epileptic children. Iran J Pediatr 2007; 17(Suppl 2):173-8. [ Google Scholar]
- Willmore LJ, Wilder BJ, Bruni J, Villarreal HJ. Effect of valproic acid on hepatic function. Neurology 1978; 28(9 Pt 1):961-4. doi: 10.1212/wnl.28.9.961 [Crossref] [ Google Scholar]
- Hadzagic-Catibusic F, Hasanbegovic E, Melunovic M, Zubcevic S, Uzicanin S. Effects of carbamazepine and valproate on serum aspartate aminotransferase, alanine aminotransferase and gamma-glutamyltransferase in children. Med Arch 2017; 71(4):239-42. doi: 10.5455/medarh.2017.71.239-242 [Crossref] [ Google Scholar]
- Sano J, Kawada H, Yamaguchi N, Kawakita M, Kobayashi K. Effects of phenytoin on serum gamma-glutamyl transpeptidase activity. Epilepsia 1981; 22(3):331-8. doi: 10.1111/j.1528-1157.1981.tb04117.x [Crossref] [ Google Scholar]
- Kürekçi AE, Alpay F, Tanindi S, Gökçay E, Ozcan O, Akin R. Plasma trace element, plasma glutathione peroxidase, and superoxide dismutase levels in epileptic children receiving antiepileptic drug therapy. Epilepsia 1995; 36(6):600-4. doi: 10.1111/j.1528-1157.1995.tb02574.x [Crossref] [ Google Scholar]
- Raghda R. Raghda RSHussein, Rasha HSoliman, Ahmed MAbdelhaleem Ali, Tawfeik MH, Mohamed EAAEffect of antiepileptic drugs on liver enzymesBeni-Suef univjbasic appl. sci 2013; 2(1):14-19. doi: 10.1016/j.bjbas.2013.09.002 [Crossref] [ Google Scholar]
- Vidaurre J, Gedela S, Yarosz S. Antiepileptic drugs and liver disease. Pediatr Neurol 2017; 77:23-36. doi: 10.1016/j.pediatrneurol.2017.09.013 [Crossref] [ Google Scholar]
- Demircioğlu S, Soylu A, Dirik E. Carbamazepine and valproic acid: effects on the serum lipids and liver functions in children. Pediatr Neurol 2000; 23(2):142-6. doi: 10.1016/s0887-8994(00)00175-2 [Crossref] [ Google Scholar]
- Sillanpää M. Carbamazepine Pharmacology and clinical uses. Acta Neurol Scand Suppl 1981; 88:1-202. [ Google Scholar]
- Arezzo JC, Schroeder CE, Litwak MS, Steward DL. Effects of vigabatrin on evoked potentials in dogs. Br J Clin Pharmacol 1989; 27(Suppl 1):53S-60S. doi: 10.1111/j.1365-2125.1989.tb03462.x [Crossref] [ Google Scholar]
- Rimmer EM, Richens A. Interaction between vigabatrin and phenytoin. Br J Clin Pharmacol 1989; 27(Suppl 1):27S-33S. doi: 10.1111/j.1365-2125.1989.tb03458.x [Crossref] [ Google Scholar]